
When you're growing virally or planning to, one of the hardest things to get right is forecasting into the future. Of course everyone expects to grow exponentially with a Viral Coefficient of more than 1, but that's rarely realistic.
Even if you do achieve a strong viral growth rate early on, you can't expect to extrapolate out that same growth rate indefinitely — eventually you'll saturate your audience. Before you can forecast growth, you need to understand how virality works, or your model is worthless. So how do you build a model that works?
First let's go through each metric you need, and roll everything together at the end into a working model like the one above. We'll be using the example of a social network where upon signing up you invite your friends. For the purposes of this exercise, we'll be using the example from our post on Viral Growth Loops.
Participation Rate
How many new users invite friends or colleagues to sign up? Note this is not how many people do they get to sign up (that's next), it's how many participate in sending invitations at all.
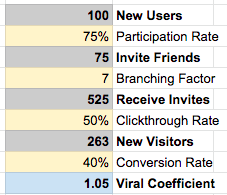
If 75% of users participate in sharing with friends and we have 100 new users, then 100 x 0.75 = 75 of them will invite friends.
Branching Factor
When a new user invites friends and colleagues, how many invites do they send on average? For Facebook it was 7 friends in 10 days, but the average will be different for each business.
If every user that participates in sharing, invites 7 people on average, with 75 people inviting friends, then 75 x 7 = 525 people will receive invites.
Clickthrough Rate
How many people click through to the website or app after receiving an invitation? This number is governed by both how compelling the value proposition is, and if they trust the sender.
If we assume a 50% clickthrough rate, for 525 invites, we'll generate 525 x 0.5 = 263 clicks, or new visitors.
Conversion Rate
What percentage of new visitors to your website or app do you convert to new users? This can be optimized by removing friction or increasing motivation to sign up.
If we take a 40% conversion rate for our social network, from the 263 new visitors we drove through invites, we would expect to sign up 263 x 0.4 = 105 new users.
Viral Coefficient
The primary measure of virality, also called K-Factor (or in epidemiology, R0 or R-naught). This is a measure of how many new users you get through sharing, for every new user you acquire.
You can calculate this metric by multiplying all previous metrics. So in our model 0.75 x 7 x 0.5 x 0.4 = 1.05 is our viral coefficient.
Modeling Viral Coefficient
To model the viral coefficient or K-Factor, we just need to multiply each step together in Excel or GSheets. This should give us a spreadsheet like this:
Now we have the number of users after one cycle (viral coefficient x new users), we need to be able to predict the number of users at any cycle in the future.
The formula is initial users x (viral coefficient ^ (cycle + 1) - 1) / (viral coefficient - 1). So for our viral coefficient of 1.05, to see 10 cycles into the future this would work out to be 100 x (1.05 ^ (10 + 1) - 1) / (viral coefficient - 1) = 1421 total users. We can model it out like so:

Once you have the virality cycles modeled out, you're most of the way there. You just need two more assumptions to make a working model — cycle time and carrying capacity.
Cycle Time
We've dictated that new users invite 7 friends, but we didn't specify how long it takes them — this is the cycle time. For Facebook it was 7 friends in 10 days, so we'll use that.
Once we have the cycle time, we can plug that into our model to estimate the number of users in any given date in the future, which makes the model far easier to understand.
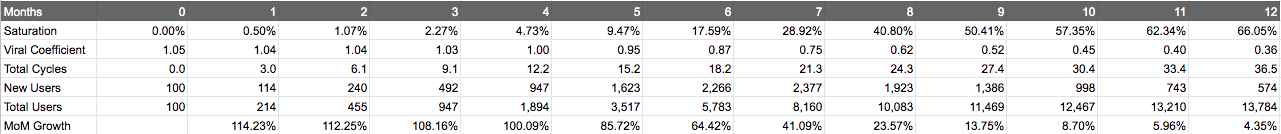
The model now takes the cycle time and translates it into dates, by working out the Total Cycles by that point in time. This let's us forecast out by 12 months and see how many users we'd have.
Carrying Capacity
Viral growth can't go on indefinitely — if you keep extrapolating the function out ten years and you'll have signed up 112 billion users... which is more people than have ever lived. As your product gains more users, there are less people to convert.
For example Facebook has signed up the majority of North America by now, so new users have less people to invite, and the people they invite are less likely to accept, because they're already on the platform or not interested.
To account for this into the model, we use carrying capacity, which is simply the size of the audience that could use your product. With a large carrying capacity the impact of saturation won't be felt, but with a limited audience your viral coefficient will quickly fall below 1.
To work this into our calculations, we assume that for every percentage of saturation that occurs, your initial viral coefficient drops by the same amount. So if you've signed up 10% of your audience, you need to decrease your viral coefficient by 10% — if you're 90% saturated, viral coefficient needs to come down by 90%.
Let's choose a relatively small audience of 20,000 to see how it impacts the model.
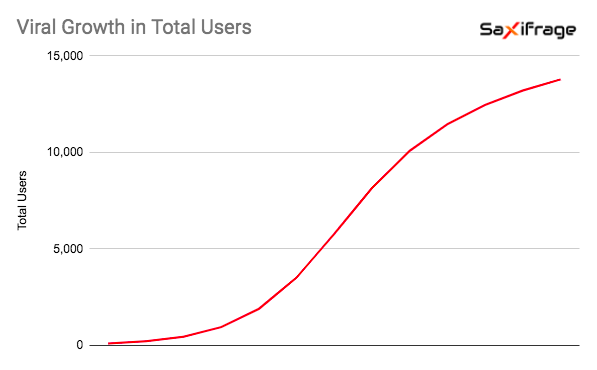
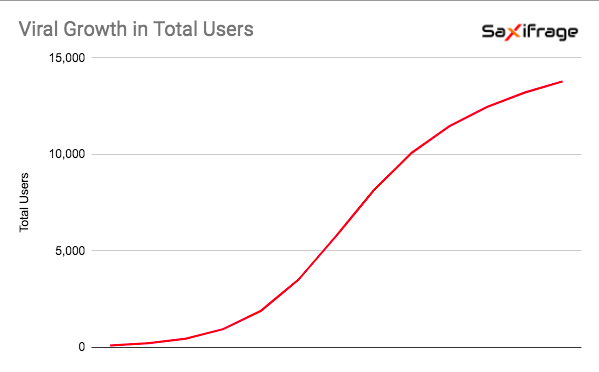
Now we have a realistic model that starts with the famous 'hockey stick' growth curve, and flattens out. When plotted visually this will form an S-shape or sigmoid, which tells us we're on the right track — you see the same curve in everything from the adoption of new technology to the spread of an actual virus.
Get the full model
To see all of the assumptions we made, and make changes to the model for yourself, you can find the full thing here:
https://docs.google.com/spreadsheets/d/1hgQs-wDXk2tOHAwaP47r4rytCtH_NXtpUesDNpIoMBU/edit#gid=0
For reference, this model was built using a combination of factors from Andrew Chen's "Facebook viral marketing: When and why do apps “jump the shark?” and David Skok's Startup Lessons Learned: Viral Marketing. I highly recommend you check these out if you're interested in the topic.

