.jpg)

It can be difficult to understand the impact your Facebook ads (or other paid channels) are having on your overall company growth. Marketing attribution is at the heart of marketing strategy — you can’t make budget decisions without knowing what’s working.
Despite the explosion in tracking and targeting technology, digital ads still aren’t as ‘measurable’ as you might have been led to believe. No matter what attribution model you use, it can be gamed, and the only channels that have the full customer view from impression to purchase, Facebook and Google, aren’t going to do anything that puts their 70% market share at risk.
The default attribution model for Facebook ads is a 1 day impression and 28 day click window. What this means is that they will claim any purchases from people who were shown an ad in the last 24 hours (even if they didn’t click or even notice it) or clicked an ad in the past 4 weeks (even if it wasn’t that click that drove the conversion).
So theoretically, if you could show an ad to 100% of the population of the United States today, Facebook will claim credit for 100% of your sales for the next 24 hours. It’s obvious that we shouldn’t be giving 100% of the credit to Facebook — most of those sales would have happened anyway! Yet it’s also not correct to say view-through conversions have no impact — you don’t ‘click’ on a TV ad and yet TV advertising is proven to be profitable.
Why Doesn’t My Facebook Ads Match Google Analytics?
This is the number one question I’d get working with startups running paid ads, and now you know the reason why. Let’s look at some scenarios where Facebook ads (which counts view through and uses a click window) wouldn’t line up with Google Analytics (which uses last click, and has no view-through data).
- I’ve been shopping with this brand for 20 years, and I click on an ad once to buy
- I see an ad in my feed and ignore it, I get an email later that day and click to buy
- I browse the news, I don’t even see the ad that loaded, I buy later that day
- I click on an ad, decide not to buy, then a week later I buy on referral from a friend
- I search on Google, visit the site, click a retargeting ad, search again in 3 weeks and buy
- I click on an ad for one product, later that week I search and buy a different product
These are scenarios that Facebook would claim 100% of the credit, where they don’t deserve it! They are counting conversions up to 1 day after a view, and 28 days after a click, despite what other channels drove that sale. The majority of these conversions would happen anyway if you hadn’t advertised on Facebook — they weren’t ‘incremental’. Let’s look at the opposite scenarios, where Facebook might not get the credit they deserve.
- I see a Facebook ad in my feed, and it reminds me to search their brand name
- I leave the site mid purchase, and I see an ad that reminds me to come back
- I click on an ad on mobile, decide to purchase, but switch over to my laptop to buy
- I see an ad in my feed, click through to buy, but decide to find a discount code first
- I click on an ad, sign up for emails, a few weeks later a deal comes in and I buy
- I see ads in my feed for months, then I remember the brand when I need to buy
These are all legitimate scenarios where Facebook will count a user but Google Analytics won’t give them credit. In these cases impressions had real value, and Facebook is right (or even conservative) to count view-through conversions with a 1 day attribution window. This is particularly important for businesses where the purchase isn’t immediate — if it takes more than 24 hours to purchase then you’re potentially seriously undercounting the impact of Facebook.
How do I measure the ROI of digital marketing?
The problem arises despite all the advanced adtech analytics tools out there, because there is a fundamental gap in knowledge between actors — one that is only likely to widen. For all the talk about surveillance capitalism, this attribution gap exists because Facebook and Google don’t share their user data! You can’t get user level data on who saw ads or clicked on them, until they visit your website.
All you know about them is what channel they came from and what campaign and ad creative they clicked on. Facebook isn’t likely to make user-level data available, because it invades user privacy and erodes their competitive advantage. Even within Google, there’s no information sharing between Google Ads and Google Analytics, that you can’t get if you install any other analytics platform. With GDPR, CCPA, and Apple’s moves on iOS with the ITP and IDFA, this gap is only likely to widen.
So despite all the sophisticated measurement tools, it’s impossible to accurately track user-level behavior one-to-one. So what do marketers do? Well the answer comes from traditional marketing — I mentioned that TV advertisers can’t rely on ‘clicks’ or ‘conversion’ tracking, because nobody ‘clicks’ on a TV ad… so how do they do it? The answer is Econometrics, also known as Marketing Mix Modelling or Linear Regression.
Measuring the ‘Halo Effect’ of Facebook Ads
To follow along with your own analysis, use this template which already comes complete with example data from a past analysis I did. The goal of this exercise will be to see if paid ads have an impact on organic traffic — specifically in this case, did high spend on Facebook ads lead to any noticeable impact on organic search traffic?
Our hypothesis is that spending money on Facebook Ads will drive new users who come through organic channels like visiting the website URL directly, or via searching for the brand term. We know that view-through should have some value — this helps us understand how much value our ads drive that isn’t accounted for on a last click basis.
For this analysis we’re simply going to do a linear regression of Facebook ad spend versus organic visits. If we expect that Facebook drives organic users we would expect to see some correlation between days of high spend and high organic traffic. If they are unrelated, we’d expect to see no pattern at all — high and low spend days don’t line up to high and low organic traffic days.
Pulling data from Facebook ads and Google Analytics
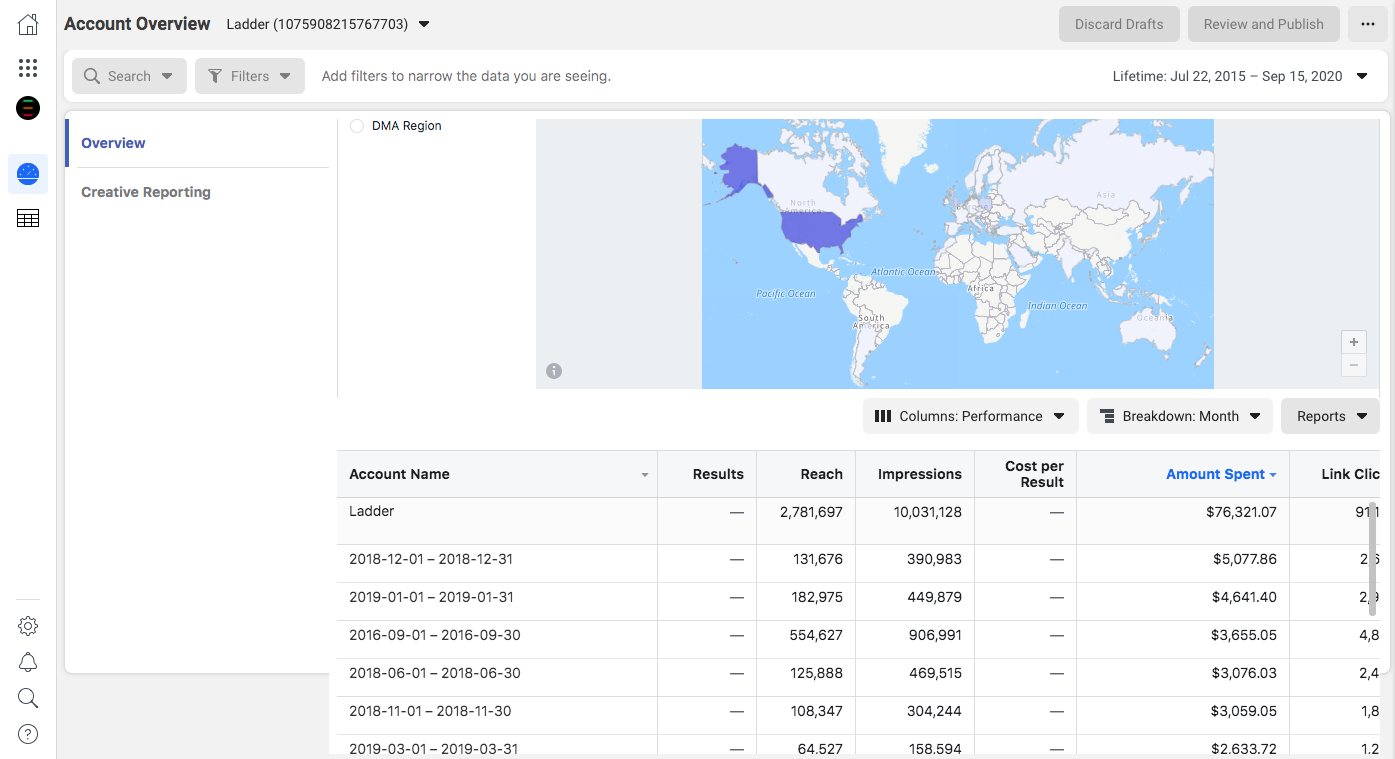
Go to your Facebook ads manager and choose a monthly breakdown. Select a date range that’s as long as possible, by choosing ‘lifetime’. Click on reports, then ‘export table data’. Make sure you have the amount spent and impressions, we’re going to ignore conversions for now.
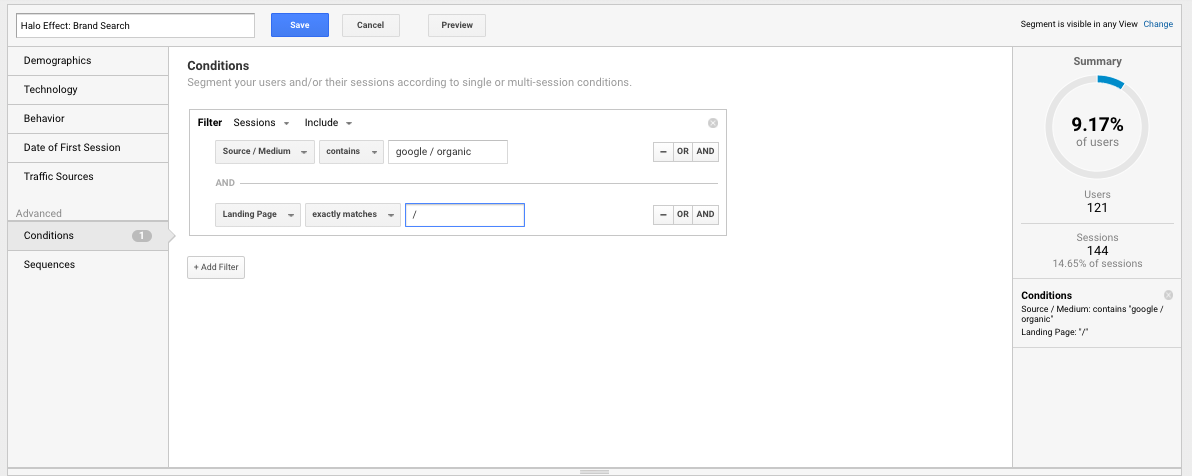
Now for Google Analytics; go to Acquisition > All Traffic > Source / Medium report. Then click on segments, add a new segment, and filter for people who have come to your site from ‘google / organic’ and landed on the homepage.
Now select your main conversion metric (for us this is all goals, as each individual goal was a lead). Select as wide a date range as you have (hopefully overlapping as much as possible with what you pulled for Facebook). Finally add a secondary dimension of ‘Month of Year’ (note: not ‘Month of the Year’).
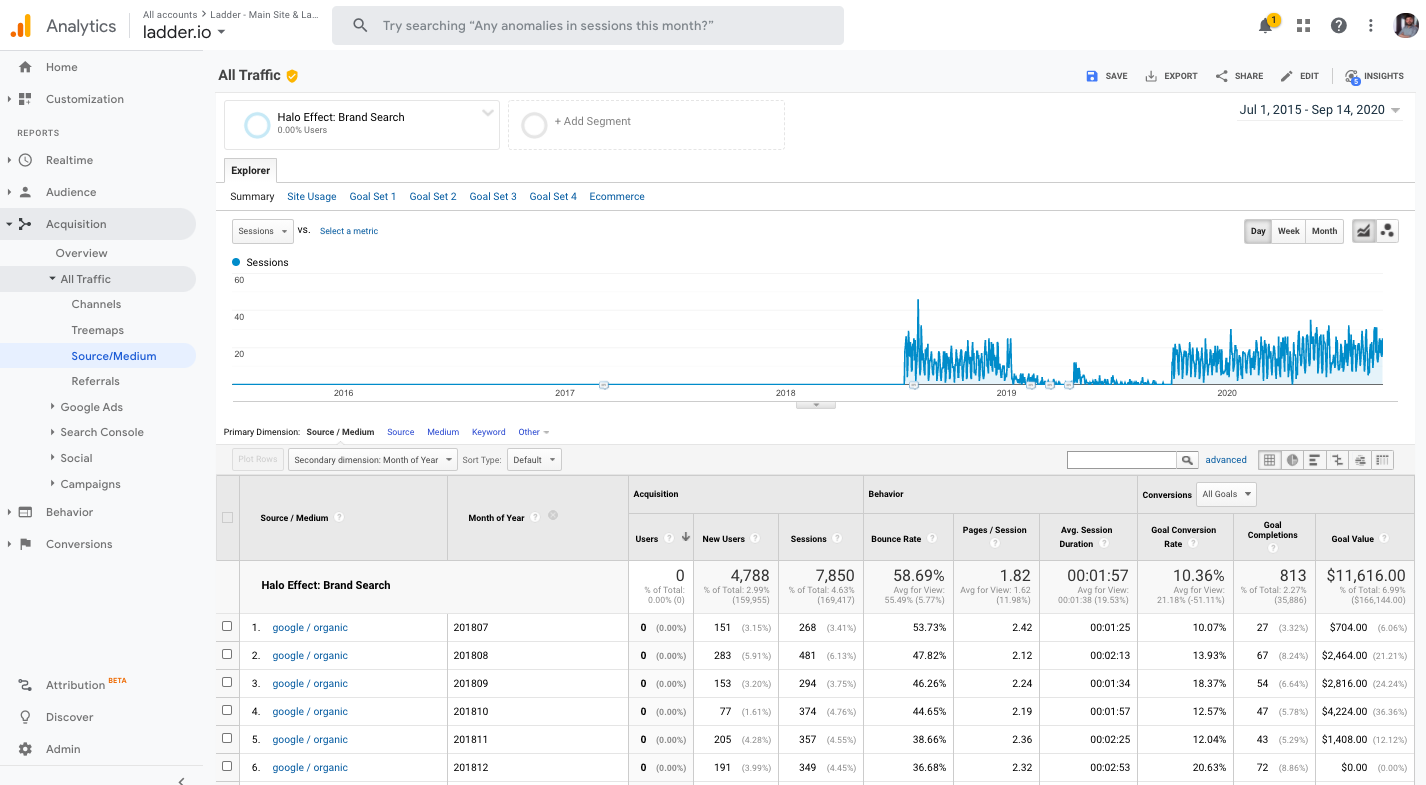
Note, if you pull the data far enough back, you’ll notice ‘Users’ disappears due to Google’s rules around user privacy, but don’t worry we only need sessions and conversions. In the bottom right corner there’s the ability to show more data on one page, you want to select enough to show all of your pages.
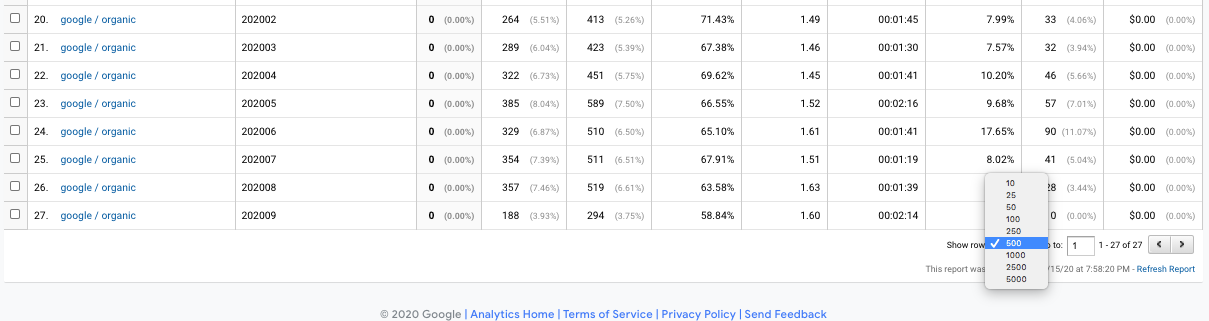
Now scroll up to the top and export the data to CSV or GSheets, ready to copy and paste across into the template.
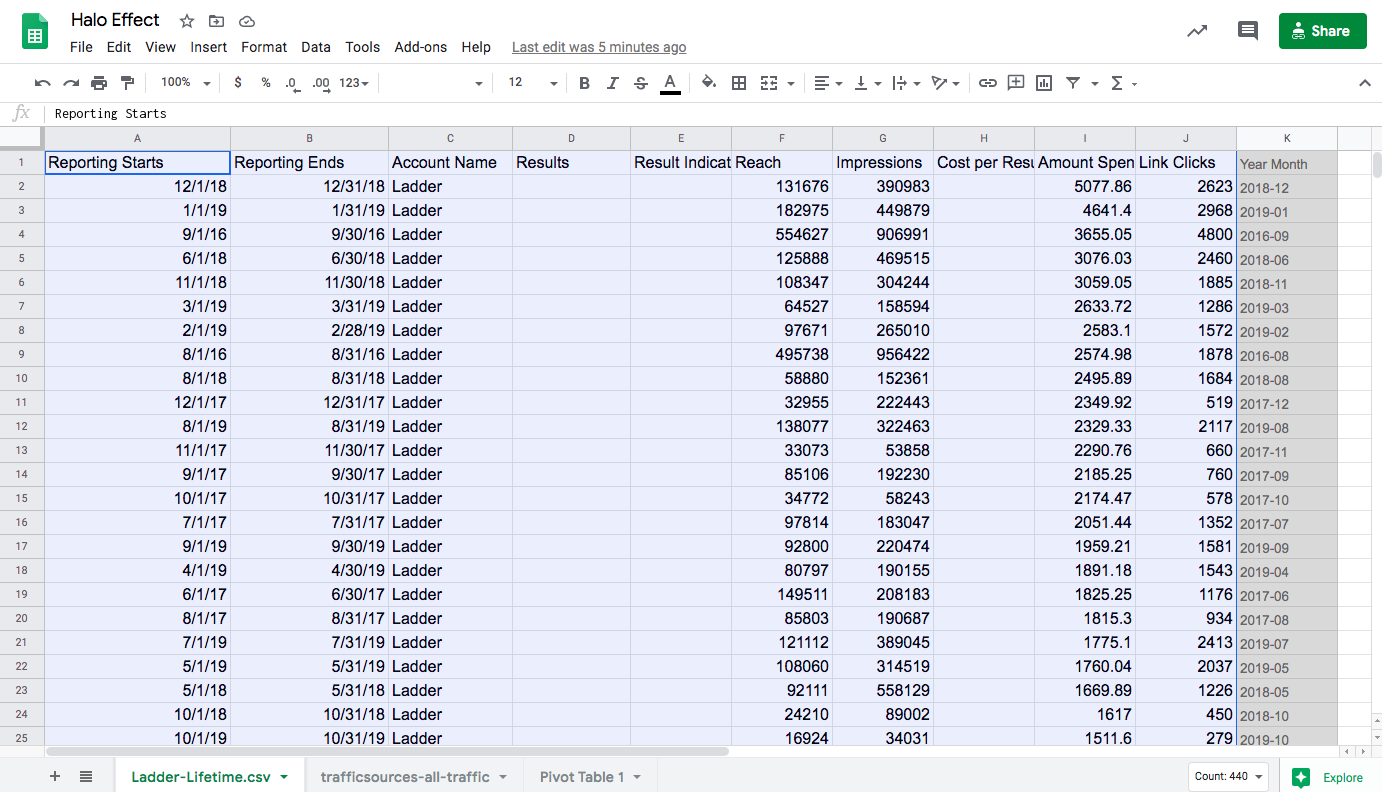
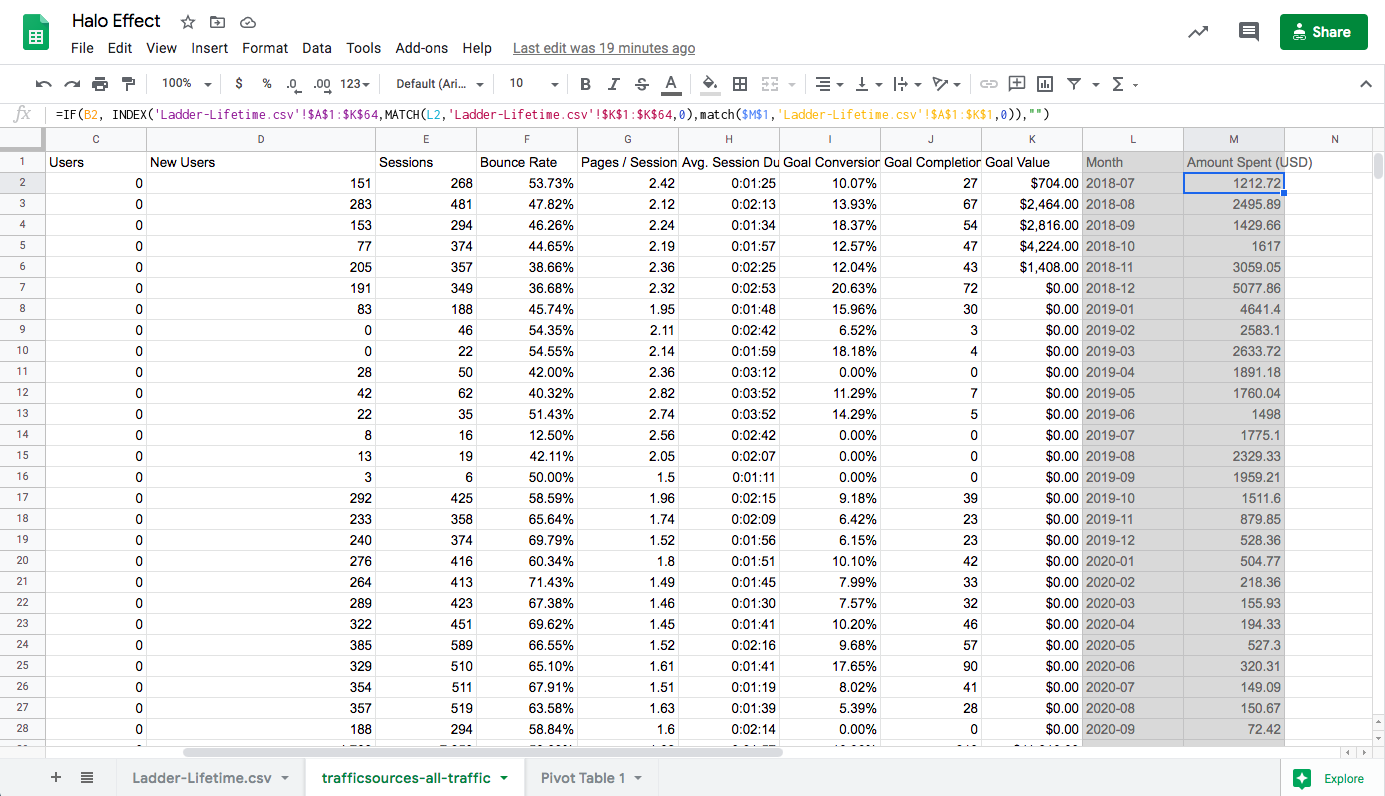
The gray column converts the year and month into the right format, so you can more easily join up to other data. In the tab for Google Analytics we have the same, but also another formula which uses INDEX and MATCH to search for the column Amount Spent (USD) from the Facebook ads tab, and join it to this table based on date. If your Amount Spent column is called something different, rename this column so it can be found.
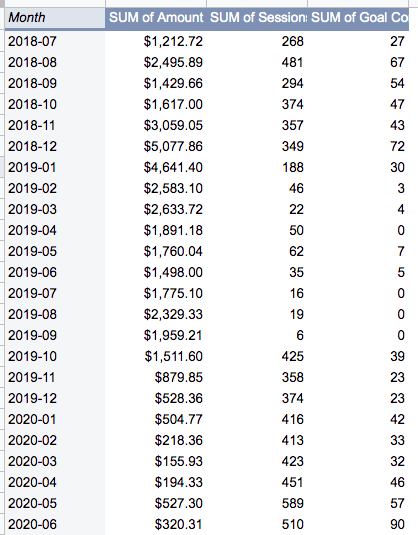
The data is then joined together in a pivot table based on the month and year. Note that if your date ranges don’t overlap, only the data that you have in analytics will show here (so you might be missing some Facebook data for months where this analytics profile didn’t have data, like is happening in our template).
If you have the opposite problem where you don’t have as much Facebook data as needed to cover your analytics, then consider deleting the date ranges where you there isn’t overlap, in order to improve the fit.
Is there a significant impact on organic traffic from ad spend?
From the data entered into the template, there will be an automatic regression analysis run using the LINEST formula. This is run against sessions as well as goal completions. If your goal is called something different you might need to drag these into the pivot table in the right order, and rename the axes of the charts.
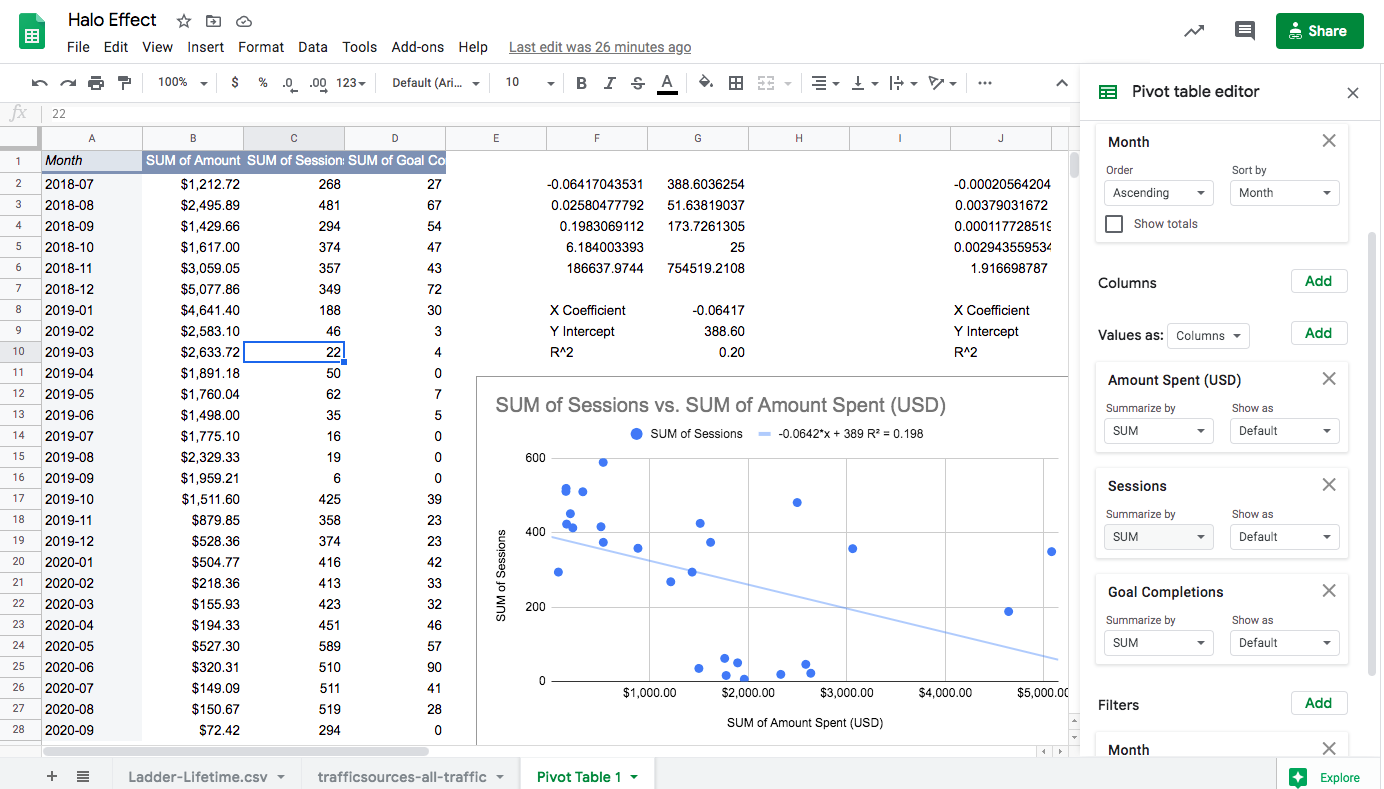
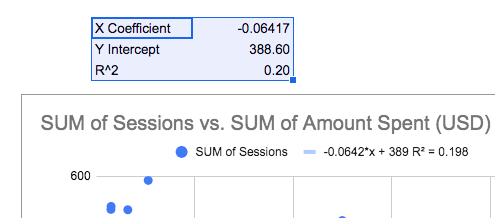
So how do we interpret the results of this regression? Well there are a few things to look out for. First look at the chart. Are the dots clustered together close to the line? Or are they spread out? Next look at the R^2 number — is it higher than 0.5? In our case it’s as low as 0.2, which is an indication of a weak correlation. If it was 1 that would mean 100% of the variance in sessions was related to what we spent on Facebook. You should also look at the slope — in this case we see a negative slope, which implies sessions were actually lower on high spending days.
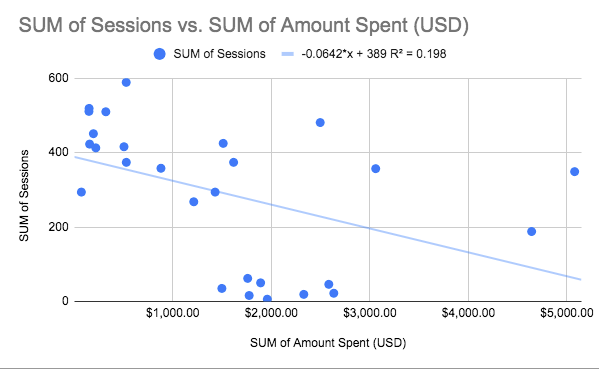
The same variables are also calculated by the LINEST formula about the chart in the spreadsheet. In our case we can see that we actually lose 0.06 of a session for every dollar more we spent on Facebook. This is a weak correlation with an R^2 of 0.20, so it would be safe to disregard any perceived impact of Facebook ads on organic sessions.
But what about goal completions? Spending on Facebook might not cause more organic sessions in a statistically observable way, but potentially people are more likely to buy in months where we spent more money? Unfortunately not — for goal completions the chart looks worse.
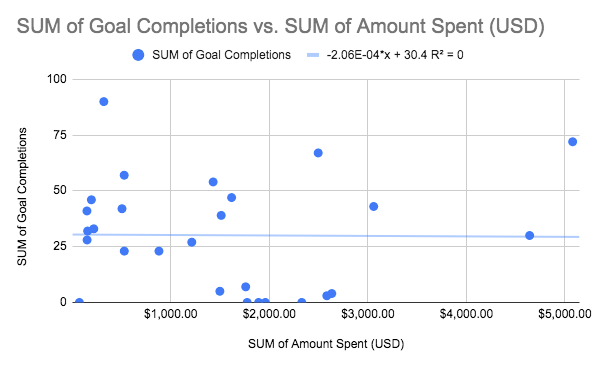
This is showing us absolutely no correlation. Even when we spent as much as $5,000 per day we didn’t see any improvement in goal completions. Now this doesn’t necessarily mean there is no effect — it might be a small effect, or perhaps there’s a confounding variable, something related to both that distorts the data. However my conclusion from looking at this data would be to be extremely distrustful of any incremental view through effect Facebook might be claiming.
Next steps after running a halo effect analysis
There’s never a positive or negative result from analysis — you either prove there is an effect (and have a new opportunity for growth) or you prove there isn’t (and can save your budget). In this case it was negative, but often I’ve run these analyses and seen positive results, for example in this case study by Orion KCB.
Regardless of the results you found, you might be wondering what the next steps are if you believe this phenomenon exists. One option if you think there might be confounding factors, is to run a full Econometric analysis. During this process you’d test out different definitions of variables, add more variables into the model and potentially tease out a real effect.
The other alternative is what’s called deprivation testing or incrementality tests — essentially you turn it off (for a randomized selection of the audience if possible) and measure how many conversions still happen. The Facebook platform does allow incrementality tests, but usually there are minimum requirements in ad spend to get a significant test. The unsophisticated way is to just turn it off for a week, on again for a week, off again for a final week, then compare the two weeks on with two weeks off to see any patterns.
Whatever method you employ (and smart marketers utilize all of them at various stages), being able to quickly run a regression test in a template like the one we used to analyze whether two variables are correlated, is a useful skill for any data-driven marketer.
---
Check out the rest of the posts in the series:
- Econometrics in GSheets
- Econometrics in Python
- Diminishing Returns
- Measuring the Halo Effect (this post)
- When Econometrics Works
In future we plan to cover:
- Word of Mouth Coefficient
- Testing Model Accuracy
- Monte-Carlo Simulations
- Machine Learning Models
- Data Import from APIs
- The Future of Econometrics
- Any other topics? Tweet @hammer_mt to request

