.jpg)

What is a good K-Factor?
This is an important metric, and while there's plenty written online about how to model it, measure it or optimize for it, most are secretive about what a good K-Factor actually is.
The typical article on virality will tell you the importance of getting to a K-Factor of 1 — anything less and your growth will decline, even a fraction above one and your growth will be exponential.
However this isn't really helpful advice. K-factors > 1 are rare, and any virality at all can contribute thousands of new users. So the question is, what's a 'normal' K-Factor for my product / industry?
In order to answer the question, I've trawled through hundreds of blog posts to find instances where people actually shared their K-Factor publicly, so I could gather them all in one place.
K-Factor Definition
K-Factor is a term borrowed from epidemiology, where it's more commonly known as the viral coefficient or R0. Strictly defined it should mean "the number of cases that are expected to occur on average in a homogeneous population as a result of infection by a single individual".
In marketing terms, it has been adapted to mean the number of new users that are acquired as a function of the number of users that sign up. This is modeled as K = i x c, where K is 'K-Factor', i is 'number of invites sent per user' and c is 'average invite conversion rate'.
However these benchmarks are drawn from passing mentions in blog posts with no rigorous academic standards — we can't know how they measured this metric, so don't take these numbers too seriously. The best benchmark is being better than you were yesterday.
Note:If you see any other public K-Factors, or want to share your own, tweet at me: @2michaeltaylor
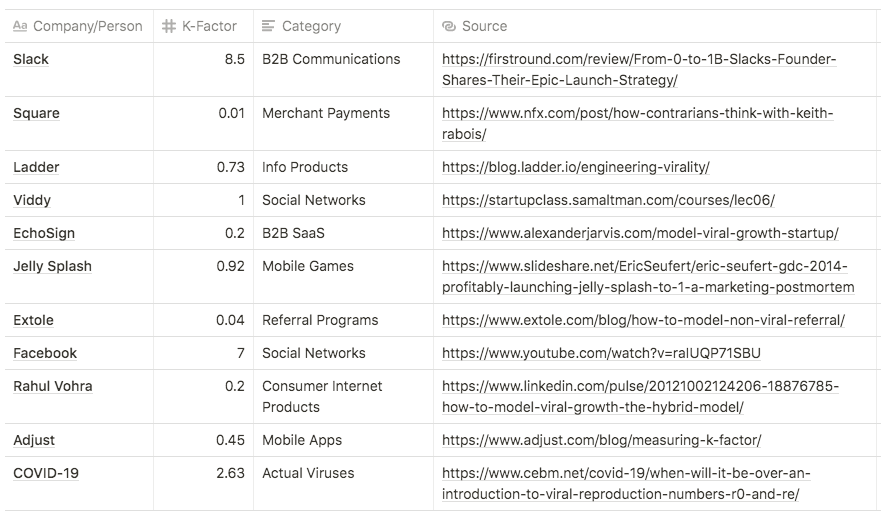
Slack - 8.5
That figure sounds daunting. Of roughly 220,000 teams that have been created in Slack, upwards of 30,000 are actively using it. “However, because one active team has an average of eight or nine members, we have close to 250,000 daily active users. We have more daily active users than teams that were ever created. So we lose a bunch, but the ones that we get to really try it out stick with it.”
Category: B2B Communications
Source: https://firstround.com/review/From-0-to-1B-Slacks-Founder-Shares-Their-Epic-Launch-Strategy/
Square - 0.01
So once you have a hypothesis, then the next question is, “Well, how do you validate that? How do you test it?” If true, there should be a ratio for every new Square we shipped, and every new customer, and every transaction in the rate of growth. Turns out there was a perfect relationship, it’s exactly 1%. So for 1% of all transactions on let’s say day zero, we have 1% of signups the next day, new signups, and they just were perfectly consistent. This is amazing. We now have an actual viral loop in the real world. We had this observability. We’ve been in the real world that’s causing growth, but it was not at all obvious.
Category: Merchant Payments
Source: https://www.nfx.com/post/how-contrarians-think-with-keith-rabois/
Ladder - 0.73
With a K-Factor of 0.73, we did fantastically well overall in terms of virality — in B2B a viral coefficient of 0.20 is far more common.
Category: Info Products
Source: https://blog.ladder.io/engineering-virality/
Viddy - 1.0
For example, let’s says 100 people get an invite per person who imports, then of those, 10% click, and 50% sign up, and of those only 10 to 20% import, you’re going to be at 0.5 - 1.0 K factor, and you’re not going to be viral. A lot of things like Viddy were very good at pumping up stories. They got the factor over 1, which is perfectly doable.
Category: Social Networks
Source: https://startupclass.samaltman.com/courses/lec06/
Echosign - 0.2
If you are a SaaS company then you are 99.999% unlikely to go viral and it will take a long time to engineer any form of virality. Echosign had a K of 0.2 and had a CT of 8 months.
Category: B2B SaaS
Source: https://www.alexanderjarvis.com/model-viral-growth-startup/
Jelly Splash - 0.92
Soft Launch
- Strong Virality: Average K-factor 92%
- Strong Retention: Minimum Day 1 Retention 50%
What We LearnedVirality decay
- K-factor decreased to 84% / eCPI increased by 28%
- Increased networks kept CPIs flat
Category: Mobile Games
Extole - 0.04
We studied the referral programs of 400 customers, and here are the benchmarks we saw:
- 19% of potential advocates become advocates
- 28 Referral Index™
- 2 shares per advocate on average
- Median 1 friend click per share
- 13% conversion rate from click to customer
Using those numbers, we have a i = .19 * 2 = .38 and we have c = 1 * .13 = .13. That gives us k = 0.0494.
Category: Referral Programs
Source: https://www.extole.com/blog/how-to-model-non-viral-referral/
Facebook - 7
After all the testing, all the iterating, all of this stuff, you know what the single biggest thing we realized? Get any individual to seven friends in 10 days. That was it. You want a keystone? That was our keystone. There's not much more complexity than that.
Category: Social Networks
Source: https://www.youtube.com/watch?v=raIUQP71SBU
Rahul Vohra - 0.2
From discussions with other entrepreneurs, investors, and growth hackers, I've learnt the following: for a consumer internet product, a sustainable viral factor of 0.15 to 0.25 is good, 0.4 is great, and around 0.7 is outstanding.
Category: Consumer Internet Products
Source: https://www.linkedin.com/pulse/20121002124206-18876785-how-to-model-viral-growth-the-hybrid-model/
Adjust - 0.45
What we ultimately found is that while K-Factor definitely exists, it doesn’t apply to the majority of apps on the marketplace.
30% of our sample had K-factor. For this 30%, our data team established that the median K-factor was .45. This means that (looking at apps performing in the middle of our sample) for every 100 paid installs, you would receive an additional 45 organic ones.
We also had a deeper look at how K-factor differed by app vertical. We started by looking at games, and (of our sample), we found that K-factor affected 22.5% of them (470 apps), while for non-Games (871 apps) it’s 33.6%. So, here, gaming apps are less affected by K-factor. In fact, it’s ecommerce apps (158 of them) that have a higher percentage of K-factor existence: 38.6 percent, while non-shopping apps have a 28.5% likelihood of K-factor by comparison.
Category: Mobile Apps
Source: https://www.adjust.com/blog/measuring-k-factor/
COVID-19 - 2.63
Estimates of the R0 of SARS-CoV-2 vary widely. Figure 5 shows nine estimates, all from studies in China or South Korea. The mean estimate of R0 is 2.63 (95% CI = 1.85,3.41). From a wider survey of 16 published estimates, the mean estimate is 2.65 (1.97, 3.09). In both cases, the range is 0.4-4.6.
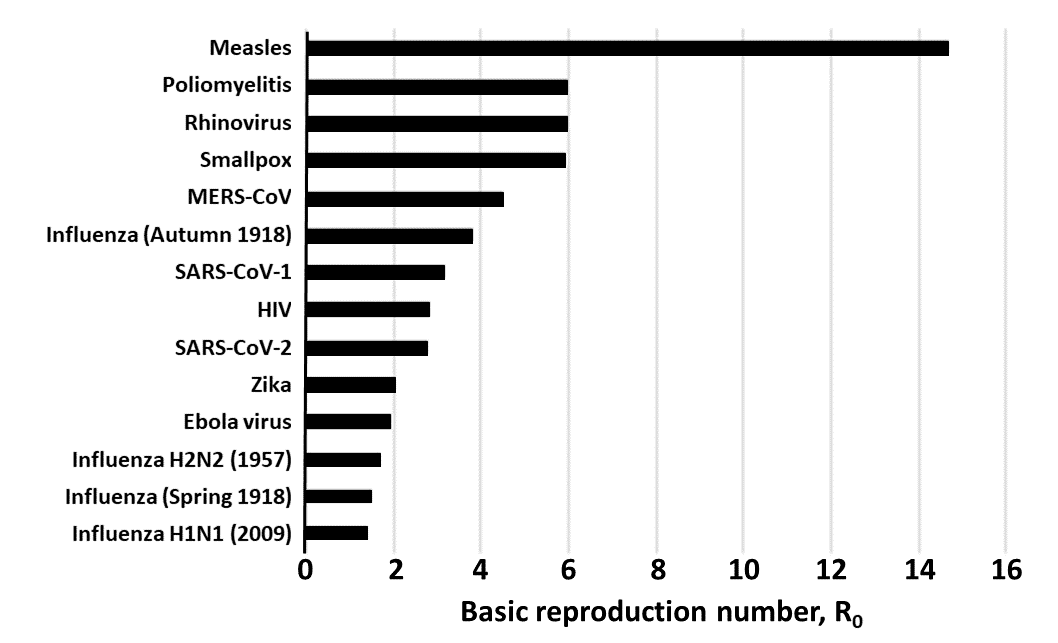
Category: Actual Viruses
Things to Keep in Mind
- True viral growth is incredibly rare - even many real viruses don't reach K > 1
- Even a K-factor of 0.2 is good - this means 1 free signup for every 5 you drive!
- Don't blindly optimize for K-factor - you'll spam users, harming long-term growth
- Retention is king - viral apps will rapidly decline if you can't retain new users
- K-factor isn't static - it changes with your product, user cohorts and audience size

